The Mathematics of Map-Making in the Renaissance
Michael Aigner
Writer’s comment: What should I write about? This question spun around in my head in the typical term-paper manner. Half of my brain suggested mathematics, my favorite subject and a field in which I already had experience writing research papers. Yet equally prevalent was the argument for something more traditionally associated with the Renaissance: Galilean physics. A history summary—the first step in the term paper process—resulted in more disarray; I saw a scarcity of relevant topics for math. Jared Haynes allayed my apprehension and convinced me to follow my interests.
I began to chart a path in the uncharted waters of cartography. Some research in the most desolate corners of Shield’s Library yielded several good sources (two of which were last stamped in the early 1970s). And sure enough, I wrote on mathematics!
—Michael Aigner
Instructor’s comment: Michael’s paper was written for the Integrated Studies class “Science in the Renaissance.” The assignment asked students to show how a scientific discipline in the Renaissance impinged on a non-scientific area of life. The border between “science” and “non-science,” of course, is somewhat arbitrary for this period of history, but the assignment gets students to write papers that are more analytical than simple reports. Several stages along the way help students pick an area, focus on a topic, and begin research. First, students read up on the history of a scientific discipline of their choosing and write a short summary of some aspect of that science during the Renaissance. Several weeks later, they hand in a rough draft of the paper and get comments back on how to focus it, improve it, and shape it, with suggestions of further sources to consider. Finally, they do an oral report on some aspect of their research and turn in a final draft.
Michael took the approach that mathematics had much to contribute to the Age of Exploration, especially to the art of map making. His rough draft was well put together and carefully written; only a few areas needed work. Michael has a good instinct for what his audience needs: he orients the reader to the main thrust of the paper, he provides good transitions between points, and he explains technical terms and methods clearly as he goes along. Best of all, he conveys the complexity of the topic without losing sight of the mathematicians who make the maps and the mariners who use them.
—Jared Haynes, Campus Writing Center
During the Renaissance, the intellectual spirit of the ancients was reincarnated. The humanists admired the works of the Greeks and through new translations endeavored to renew the truths these books embraced. Other scholars searched for fresh truths in the world around them. One “feature of this questing and questioning age was the . . . exploration” of the earth (Williams 6), culminating in the need for cartography. Under the influence of humanism and navigation, the ambition for an improved means of describing the globe originated. From around 1500 to the middle seventeenth century, mathematicians invented new representations of the world, highlighted by the map known today as Mercator’s Projection. Despite strong opposition, this novel paradigm eventually received the support of both mathematicians and mariners.
The impulse for the paradigm originated in the Age of Exploration. No longer were the sea lanes confined to the Mediterranean and to the Atlantic coast of Europe. During the late 1400s and early 1500s, the Portuguese sailed around Africa and the Spanish discovered America. No longer could the spherical nature of the earth be ignored. Early maps assumed the world was flat—a reasonable assumption for the relatively small regions covered by these charts. As the areas increased, the errors caused by the misrepresentation of the curvature of the earth became acute. Mathematicians recognized the demand for a scheme that translated the points on a sphere onto a plane.
At the same time, the discovery and translations of Ptolemy’s Almagest and Geography further inspired mathematicians. These works underscored the conjectures of the ancients. In his books, Ptolemy discussed the rudimentary principles of depicting the spherical world on a plane chart (Williams 13), providing a precedent for the inventions to come. The climax of Greek influence on mathematical cartography came with the widely circulated 1513 version of Geography (Crone 75).
In his 1537 work, Defense of the Sea Chart, Pedro Nuñez laid a second indispensable foundation for map making; he explained the nature of the rhumb line, or loxodrome (Williams 42). The rhumb corresponded to a course of fixed direction. Since direction was defined relative to the lines of longitude (meridians), the angles between the rhumb and each successive meridian were fixed as well. Nuñez correctly postulated that on the surface of a sphere like the earth, the loxodrome represented a spiral approaching the pole (Figure 1).
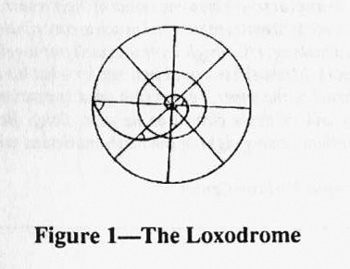
One of the major aspirations of cartography was to depict the loxodrome by a straight line on a plane chart so that a ship’s course could be plotted using a ruler. Nuñez could not solve the mystery.
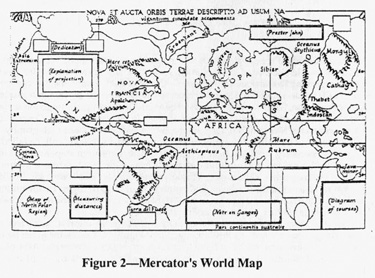
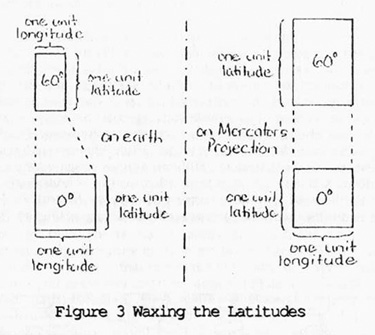
However, thirty years later, Gerard Mercator succeeded. In 1569, he published a world map utilizing a novel mathematical projection (Figure 2). To represent a rhumb as a straight line, Mercator devised a grid of lines of latitude and longitude. He reasoned geometrically that, since the rhumb line was to be straight and the angles with the meridians were to be constant, the meridians themselves had to be parallel (Crone 114). On a globe, these same lines of longitude converged at the poles. To make his map, Mercator in effect stretched the meridians proportional to the secant of the latitude (more stretching at greater latitudes), resulting in distortion. However, Mercator “achieved conformality by waxing the latitudes” (Williams 44); he elongated their scale also by a factor of the secant of the latitude. On the earth, the lines of latitude remained evenly spaced while the lines of longitude converged. Yet, on Mercator’s Projection, the meridians were equidistant and the lines of latitude diverged (Figure 3).
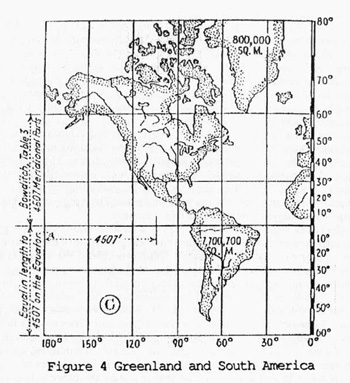
Mercator discerned the problems his scheme produced and attempted to minimize the distortions. He succeeded on the small scale. “At any point, the angles [were] correct,” preserving “the shape of small areas” (Crone 114). However, the divergence of the lines of latitude yielded inaccurate representations near the poles. On a modern Mercator Projection, Greenland appears as large as South America, although the surface area of the latter on earth is nearly ten times that of Greenland (Figure 4). Despite this apparent weakness, Mercator’s paradigm revolutionized Renaissance cartography.
While Mercator introduced the new chart and received due credit for it, he failed to provide the necessary mathematical framework. The projection depended on the distortion of dimensions at great latitudes, but Mercator did not produce a means of calculating the magnitude of this error (Taylor, Mathematical Practitioners 45). In 1599, Edward Wright secured the mathematical foundation of the paradigm. He formulated a proof of the construction of the projection (Crone 115) and published the requisite table of size distortions (Taylor, Mathematical Practitioners 45).
At the same time, Wright, in collaboration with Thomas Harriot, analyzed the nautical triangle that Mercator’s Projection yielded (Figure 5). The vector given by the ship’s speed and direction was considered the hypotenuse of a right triangle on the plane chart. The legs of this triangle consisted of the changes in latitude and longitude for some unit of time.
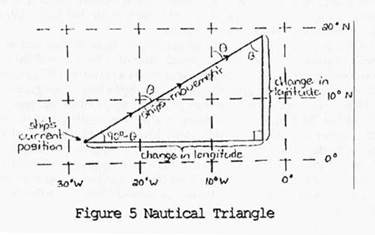
Given two of the above parameters of the triangle, the others were calculated using simple trigonometry (Taylor, Haven Finding 224). A similar application of Mercator’s work involved a technique of triangulation. Tycho Brahe and Richard Norwood, among others, postulated that, given the distance between any two points on earth whose locations (latitude and longitude) were known, the displacement between any other known coordinates could be determined using spherical trigonometry (Williams 89). Theoretically, Mercator’s Projection and its various applications provided a useful apparatus for navigation.
Unfortunately, those most intimately involved with navigation—the mariners—repudiated the value of the paradigm. They failed to understand Mercator’s Projection and thus refused to accept it (Crone 125). Part of this reception was Mercator’s own fault. Although he designated the map “for sailors,” it was “essentially a scholar’s map” (Taylor, Haven Finding 222): Mercator abandoned common cartographic conventions and provided legends in Latin—not in the vernacular. The average sailor did not have the education necessary to comprehend this invention.
As the details of the model became openly available, the opposition grew. Many navigators regarded even the idea of a mathematical projection of the perfectly spherical earth onto a plane chart as “black magic” (Williams 45). At the same time, mariners claimed that the convergence of the meridians at the poles was ridiculous and imaginary; after all, nobody had ever physically experienced this phenomenon (Taylor, Haven Finding 176). The obscure concepts of the rhumb line, the loxodrome, and spherical trigonometry were also beyond their grasp. By rejecting the above notions, the navigators opposed the basic foundations of Mercator’s Projection. They maintained their faith in the proven old maps and resisted the change to the strange new paradigm.
In 1623, Edmund Gunter, using an ingenious slide rule, illuminated for the skeptical the advantages of Mercator’s Projection. Gunter’s sector had scales of trigonometric functions on one side and a scale of size distortions on the other side (Taylor, Haven Finding 228). These tools, together with a concise explanation of the uses of trigonometry in nautical triangles, gave the mariners an elementary understanding of the mathematical superiority of the new plane chart. Although some holdouts still disdained the projection, Gunter enlightened many cynics.
Despite the objections of the common people, the work of Mercator inspired many of his contemporaries. Even before the world map of 1569 was published, the Spanish employed parallel meridians to depict the earth on a plane. In 1551, Martin Cortés used the width at 37 degrees latitude as a basis for spacing the lines of longitude (Taylor, Haven Finding 190). This approximation was practical since most navigation at the time occurred within 20 degrees of latitude of the 37th north parallel. Petrus Plancius provided another alternative to Mercator’s Projection. His 1592 world map was designed on a simple cylindrical projection. All of the positions on the earth corresponded to points on a cylinder; again, the lines of longitude were parallel (Crone 124). While this scheme mimicked that of Mercator, the mathematical reasoning was less abstract. By accepting the idea of parallel meridians, Cortés and Plancius indirectly promoted the new paradigm.
Richard Norwood researched one step further. He realized that a segment of a great circle represented the shortest distance between two locations on a globe (Mixter 138). This special curve on the sphere could not be given by one straight line on a plane map. Norwood’s method involved plotting segments of the great circle on a Mercator chart and approximating it by a succession of short rhumb lines (Taylor, Haven Finding 233). This technique incorporated several of the key innovations of Renaissance mathematics and cartography: the rhumb line, Mercator’s Projection, and the nautical triangle.
The Renaissance was a period of the rebirth of the innovative spirit of the ancients. Before this rejuvenation, mathematicians and mariners were unwilling or unable to see the correlations between their fields (Williams 41). However, during this era, mathematicians responded to the needs with an advanced form of cartography. Although acceptance from the sailors was sluggish, the new paradigm signified the rebirth of cartography and navigation. Even today, Mercator’s Projection is the “system by which most maps used by mariners are constructed” (Mixter 135).
References
Crone, G. R. Maps and Their Makers. London: Hutchinson, 1964.
Mixter, George W. Primer of Navigation. New York: Van Nostrand Reinhold, 1967.
Taylor, E. G. R. The Haven Finding Art. New York: Abelard-Schumann, 1957.
Taylor, E. G. R. The Mathematical Practitioners of Tudor and Stuart England. Cambridge: Cambridge UP, 1954.
Williams, J. E. D. From Sails to Satellites: The Origin and Development of Navigational Science. Oxford: Oxford UP, 1992.